
Poker Variance Calculation for 9 Player Sit and Go
Today we are about to calculate the variation specifically focused on Poker, namely on the Sit and Go (SNG) mini-tournament for 9 players. It will be shown, how we can calculate the expected profit in a single SNG and how real profit can vary from the expected profit based on the variance. That e.g. will give us the answer for this question: "How many SNGs do we have to play in order to reach a zero profit at worst?" The knowledge of the variance is a must for every serious poker player.
Basics
If the topic "Poker Variance" is completely new to you or you are less familiar with that, try going through our prior published articles, where you will find both basic and advanced information. We believe that they are very useful and will give you a flavor of what it is about:
- What Is Variance and $ EV Adjusted?
You can find out a basic description of the variance and a role of chance. Additionally we introduce a way that enables to calculate whether you have been lucky or unlucky in a certain period of time. - The Meaning and Step-by-Step Calculation of Variance based on a Simple Example.
The principle, meaning and calculation of the variance is explained in detail by a simple example of two coin flipping games. You only need paper, pen and calculator to persuade yourself that it is not as hard as it may seem at first sight. The calculations of variance in poker are completely the same and today's example of the 9 max SNG are based on it as well.
Example of 9 Player Sit and Go
In today's example of poker variance calculation we will play a SNG tournament for 9 players with the buy-in $5+0.5. The first three places are paid in the ratio 50/30/20. The prize pool is 9 players × $5 = $45. The fifty cents is a commission for an operator of the tournament (rake) that does not come into the prize pool.
For the first place a player receives 50% of $45, thus $22.50. The net profit, i.e. after deduction of $5, is $17.50. The same procedure is used for the remaining paid positions. While, to make this example easier, we do not take into account the rake and rake back and/or any other bonuses that could be obtained for playing. We can recap the possible earnings (net ones are in the brackets):
1st place: $22.50 ($17.50),
2nd place: $13.50 ($8.50),
3rd place: $9.00 ($4.00),
4th – 9th unpaid positions: $0.00 (-$5.00).
What is the expected earning? First we have to look into the statistics to find out how frequently we get on the paid positions. The data can be stipulated in pro cents directly or in absolute counts. For instance we could see that we were able to win the first place 1,300 times out of 10,000 SNGs, that is 13%. This number can be considered as the probability of winning the 1st place again in the future. Let us say that the probabilities of placing in the tournament are the following (in pro cents):
1st place: 13%;
2nd place: 12%;
3rd place: 10%;
4th – 9th unpaid positions: 65% (completion of 100%).
Calculations of EV, VAR and SD
We have the two essential data: (1) the probabilities of placing in the tournament and (2) the net earnings that we are likely to gain; but of course we also consider the possibility of ending up on the unpaid place and thus of losing the buy-in. That is all we need for all calculations; they are:
- Expected earnings (or profit however it can be negative too) based on the expected value (EV);
- Variance (VAR) as the squared dispersion from the expected profit; and
- Standard deviation (SD) that enables us to determine the intervals, in which our real earnings are to be found with the very high likelihood.
All input data (the probabilities and the net earnings) as well as the calculations are shown in tabular manner by Table 1.
Table 1: The Calculation of EV, VAR and SD for 9 Player Sit and Go
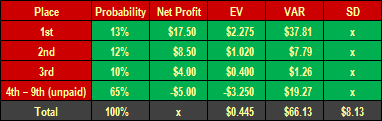
The values of EV, VAR and SD were arrived at by the below calculations. If it is needed and/or desirable for you to understand them better, please visit the above-recommended page Variance – A Simple Example, whereas all calculations are commented clearly in high detail.
EV = 0.13 × $17.5 + 0.12 × $8.5 + 0.1 × $4 + 0.65 × (−$5) = $2.275 + $1.020 + $0.400 − $3.250 = $0.445.
Very briefly to the EV: the probabilities of placing (in decimal form, 13% = 0.13 etc.) times the possible earnings minus the probability of losing times the loss of the buy-in.
After a single SNG tournament for 9 players we can expect—based on our long-term results—the profit of precisely $0.445 (or 44.5 cents). That would indicate the Return On Investment (ROI) = 8.09% ($0.445 divided by the buy-in $5.5 times 100%).
VAR = 0.13 × ($17.5 − $0.445)2 + 0.12 × ($8.5 − $0.445)2 + 0.1 × ($4 − $0.445)2 + 0.65 × (−$5 − $0.445)2 = $66.13.
The variance (VAR) shows the possible dispersion of the values (earnings). By squaring the differences between the individual earnings and the expected earning we make all negative values turn positive. Then every squared difference is weighted (multiplied) by its probability (of placing in the tournament). And finally we get the standard deviation (SD)—which shows how much the real earnings can deviate (into both the minus and the plus) from the expected earnings (EV)—by simply extracting the root of the variance (VAR):
SD = square root of $66.13 = $8.13.
Please note that the calculations are made via MS Excel and not rounded. Excel uses 15 decimal values as standard, but we usually display only 2 of them.
Likely Interval of the Real Earnings
Now we can use a statistical rule of three standard deviations (aka 3 SIGMA)—you do not have to think about it, but simply take it as a fact (you will recognize its practical value by the examples below)—, which says that:
- Almost 70% of all values (precisely 68.27%) is found in the interval
EV ∓ SD; - Approx.
95%of all values (precisely 95.45%) lies in the intervalEV ∓ 2 × SD; and - Approx.
99%of all values (precisely 99.73%) lies in the intervalEV ∓ 3 × SD.
Can you see: one, two, three sigma(s)? In other words, precisely 68.27% of our possible earnings will be lying in the distance of minus/plus one standard deviation (SD) from the expected-mean value (EV); precisely 95.45% of all possible earnings will be lying in the distance (or the interval) of minus/plus two (times) standard deviation (2 SD) and precisely 99.73% in the interval of minus/plus three (times) standard deviation (3 SD) from the mean expected earnings (EV).
We will focus mainly on the two last intervals, 95% and 99% in a simplified way, that almost reach certainty (100%). Just an appendix: minus SD (with whatever multiplication) determines the lower limit of the interval (min), while plus SD gives the upper limit (max).
After 1,000 SNGs Played ... What Can We Expect?
Suppose we decide to play 1,000 SNGs for 9 players. What can we expect and/or how can we utilize the above-mentioned knowledge and calculations of EV, VAR and SD?
We build up on a simple assumption that if we expect the average profit to be $0.445 in one SNG, then after 1,000 SNGs we can expect the one thousand times bigger profit (EV), thus 1,000 × $0.445 = $445. Also the variance (VAR) will be that bigger, i.e. 1,000 × $66.13 = $66,134 (let us remind that the calculations are not rounded). But be careful as the standard deviation (SD) is a square root of the variance (or a single SD times the square root of 1,000 tournaments played).
1,000 SNGs:
EV = 1,000 × $0.,445 = $445 (or $8.13 × square root of 1,000 = $257).
VAR = 1,000 × $66.13 = $66,134
SD = square root of $66,134 = $257
Let us determine the lower (min) and upper (max) limit of the intervals 95% and 99%.
95% (precisely 95,45%):
min = EV − 2 × SD = $445 − 2 × $257 = −$69
max = EV + 2 × SD = $445 + 2 × $257 = +$959
What does result from these calculations? I expect the average earning or profit of $445 after 1,000 SNGs played. The real profit (or loss)—with 99.45% likelihood–will lie in the range between −$69 and +$959. It can also be said in these words: after 1,000 tournaments we should earn about $445, but if we were extremely unlucky, we could even lose $69 (downswing). On the other side it would be possible that if we were extraordinarily lucky (upswing), then we could earn up to $959 (both values as compared to the expected +$445).
We can state one more thing: Even though we are expected to win 44.5 cents out of each SNG $5+0.5 played, one thousand tournaments—with our variance—is insufficient to prove the expectation with the 95% likelihood as in the worst case scenario we could lose $69.
We can ask a question, how many SNGs do we have to play at minimum not to lose a dollar? It means that we look for such a number of tournaments n, whereas the lower limit of the interval (min) equals zero. After modifications we arrive at the following formula (in that the values of VAR and EV are for a single tournament):
n = 4 × VAR ÷ EV2
After substitution into the formula n = 4 × $66.13 ÷ $0.4452 = approx. 1,336 tournaments.
We have to play at least 1,336 SNGs so that there is 95% likelihood that we end up with neither profit nor loss in the worst case scenario.
Let us see what happens if we want to increase the rate of likelihood to more than 99%.
99% (precisely 99.73%):
min = EV − 3 × SD = $445 − 3 × $257 = −$326
max = EV + 3 × SD = $445 + 3 × $257 = +$1,216
With the rise of the likelihood to more than 99% we also have to count on the fact that the interval of all possible values (earnings) enlarges as well. Unlike the 95% interval we take minus/plus three standard deviations (3 SD) around the expected-mean value (EV).
The expected profit does not change and is the same $445 out of 1,000 SNGs, while there is more than 99% (99.73%) likelihood that our real profit (or loss) will range between −$326 and +$1,216. In case of extreme bad luck we could lose up to $326, even though we play a reasonably good poker (ROI = 8.09 %). The probability allows that. On the other hand the variance "shoots" the opposite direction too, hence, being very lucky, we could earn up to $1,216 in contrast to the expected $445. Again, the following question may be asked.
How many SNGs do we have to play not to lose a dollar with the 99.73% likelihood?
The basic condition is the same as for the 95% interval, the lower limit (min) must equal zero. However there are three standard deviations in effect (3 SD), hence the formula for the minimum number of tournaments n, is the following:
n = 9 × VAR ÷ EV2
Let us input the values of VAR and EV for a single SNG into the formula:
n = 9 × $66.13 ÷ $0.4452 = approx. 3,006 SNGs.
We would have to play 3,006 tournaments at minimum in order to reach at least zero profit with the 99.73% likelihood. Have you noticed that the rising of the probability of not losing by about 4 pro cent points (from 95.45% to 99.73%) means that the number of tournaments played must be more than doubled? Let us verify it and the calculations.
3,006 SNGs:
EV = 3,006 × $0.445 = $1,338
VAR = 3,006 × $66.13 = $198,800
SD = square root of $198,800 = $446
We are still covering 99.73% of all possible earnings:
min = EV − 3 × SD = $1,338 − 3 × $446 = $0
max = EV + 3 × SD = $1,338 + 3 × $446 = +$2,676
We can see that after 3,006 SNGs played we are expected to earn $1,338 (that is an estimation of average or mean value) and that—with the 99.73% likelihood—we can end up with zero profit at worst, thus not losing a dollar.
Conclusion
This example of the poker variance calculation for a Sit and Go tournament for 9 players has shown the meaning of variance and its impact on the practical play. Even a good poker player—poker is about skill, not chance—with a good strategy, which secures him a long-term positive return (ROI), may experience a period of time, when he earns nothing or even loses. The reason is the variance as it represents possible deviations from the player's long-term expected profit (= ROI).
The poker player must accept the variance as a fact and be patient. It may be unpleasant, especially when having bad luck period. Nevertheless with a good long-run strategy the variance is suppressed—the more hands (tournaments) are played, the closer the results will move towards the long-term average. It is desirable for any player to strive for the maximum EV possible and the minimum VAR possible.
As the variance works both directions (minus/plus), it may even be pleasant as it shows how high your earnings can go when being extremely lucky. However in the long run—that is after a great number of games/tournaments played—the earnings come back to the average.
Higher variance demands bigger capital and better bankroll management. With greater deviations one needs to have a bigger capital and play a greater number of tournaments so that his (good) strategy can prevail. Therefore the player who seeks as stable earnings as possible, or even does poker playing for living, must be interested in as low variance as possible.
The article is based on my Czech article Výpočet variance u Sit and Go turnaje pro 9 hráčů.